
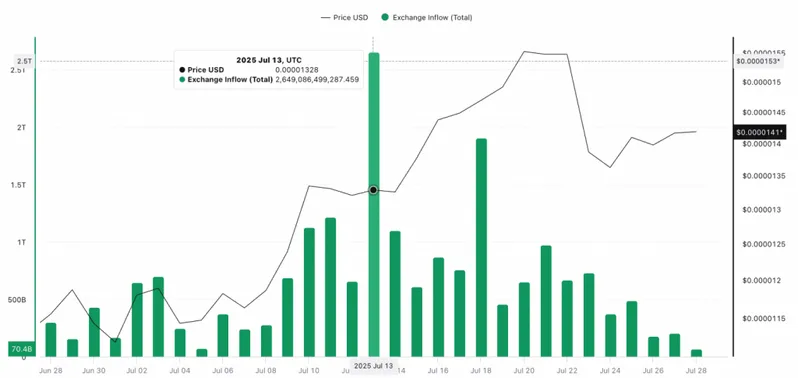
Shiba Inu’s inflow drop data actually shows a massive 97% decrease from 2.65 trillion tokens to just 70.43 billion, and this is creating some pretty ideal conditions for a Shiba Inu price rally. This dramatic reduction in exchange flows indicates reduced selling pressure right now, with analysts projecting a Shiba Inu breakout signal that could drive prices toward the Shiba Inu $0.000015 prediction target.
Whale Activity And Breakout Signal Fuel SHIB $0.000015 Prediction

The Shiba Inu inflow drop from July 13 to July 28, as CoinMarketCap reveals, represents one of the most significant reductions in exchange activity this year, and actually this Shiba Inu whale activity pattern typically precedes major price movements. Fewer tokens flowing to exchanges suggests that large holders are maintaining their positions rather than preparing to sell right now.
Also Read: Shiba Inu on the Brink of Facing $52 Million in Liquidations
Technical Setup Points to Major Rally
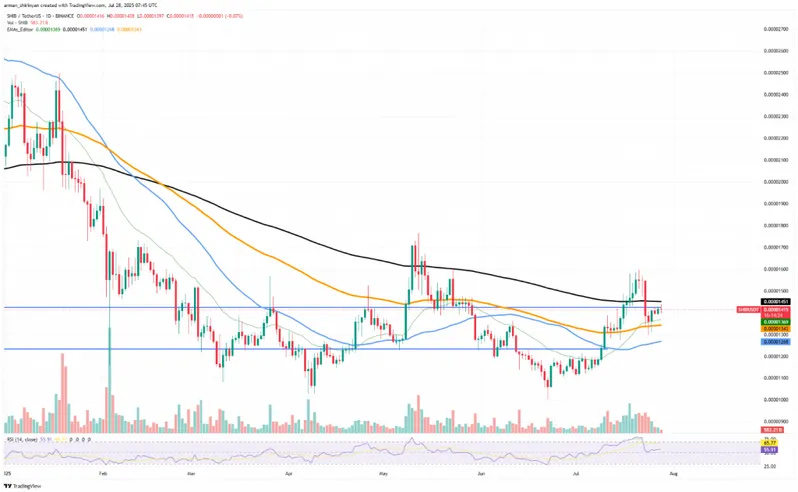
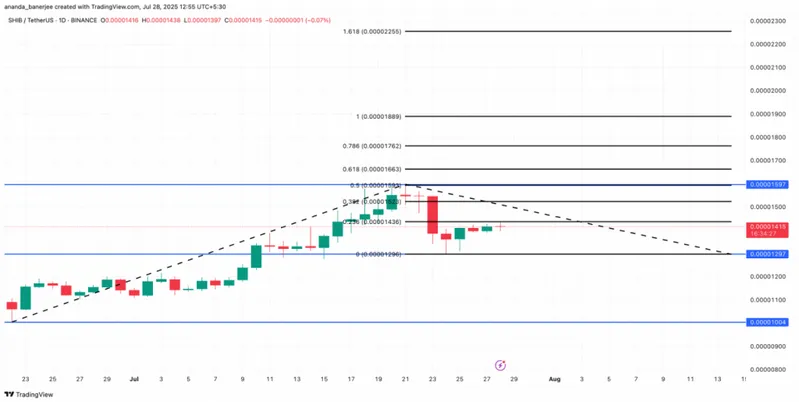
SHIB currently trades near $0.000014, along with the Shiba Inu breakout signal pointing toward resistance at $0.000015. The Shiba Inu price rally potential becomes clear when examining holder distribution data, which shows that only 18.25% of addresses are actually profitable while 78.37% remain out of the money at the time of writing.
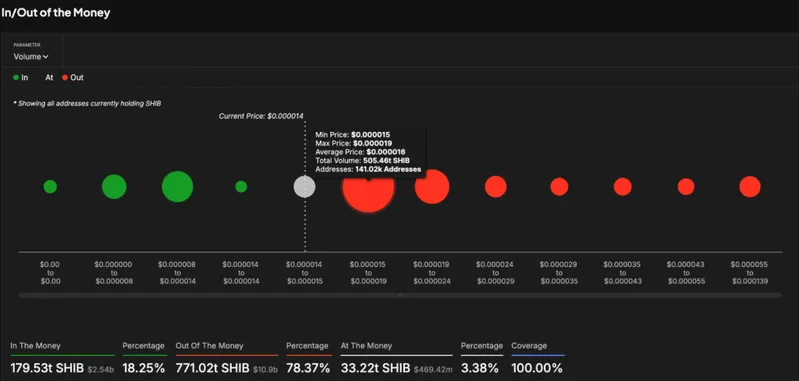
The largest cluster of holders sits between $0.000015-$0.000019, and this creates overhead resistance. However, once this zone gets cleared, the path opens for a 57% surge toward $0.000022. The Shiba Inu $0.000015 prediction serves as the critical breakout level that could actually trigger this massive rally.
Volume Concerns and Risk Factors
Despite the bullish Shiba Inu inflow drop, volume analysis reveals declining trading activity during recent green candles right now. This “on zero” breakthrough pattern has been shown historically to have weakness, though the RSI at 56 provides some room for upward movement.
The Shiba Inu whale activity reduction creates favorable conditions, but any Shiba Inu price rally needs volume confirmation along with momentum. If the $0.000012 support breaks, the Shiba Inu breakout signal could actually turn bearish, invalidating the Shiba Inu $0.000015 prediction.
Also Read: Can Shiba Inu Burn Enough Tokens to Hit $1?
The combination of reduced exchange inflows and technical resistance creates a setup where the Shiba Inu inflow drop could fuel significant upward momentum once key levels break, even though volume remains a concern.