
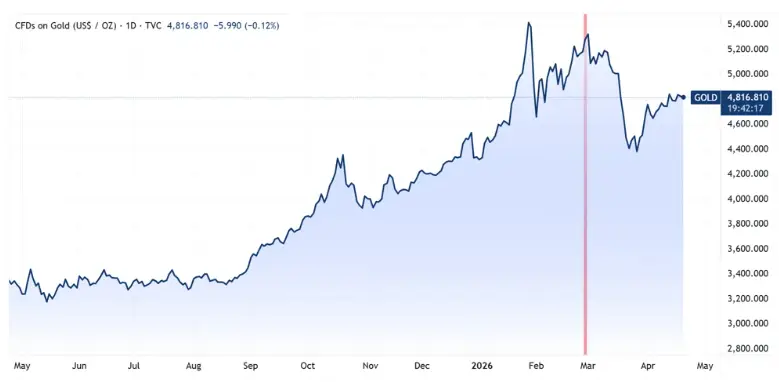
The gold price forecast has shifted sharply. Gold has shed around 8% since the Middle East conflict began on February 28, and Morgan Stanley now puts its second-half 2026 gold price forecast at $5,200 per ounce — down from a prior bull case of $5,700. The Morgan Stanley gold forecast revision reflects a market where rising yields gold outlook concerns dominate and fed rate cuts gold price expectations have moved to September and December at the earliest. This gold target reduction leaves the revised target roughly 8% above the current price of around $4,825, and well below where the metal was just weeks ago.
Gold Price Forecast And Morgan Stanley’s Gold Target Cut Outlook

Why the supply shock broke gold’s run
To understand why the gold price forecast collapsed so quickly, the nature of the shock matters more than its size. Gold has a strong historical record in demand-shock environments — recessions, financial crises, and geopolitical flare-ups where equities fall, central banks ease, and real yields drop. The Middle East crisis followed a different playbook entirely. It created a supply shock that sent oil higher, pushed inflation expectations up, lifted real yields, and stripped away the macro conditions that had driven gold’s generational run through 2025.
Morgan Stanley analysts stated:
“In previous demand driven shocks, gold typically benefited from falling 2-year yields, as markets moved to price weaker growth and earlier Fed easing. The opposite has been true this time. This was also seen in 2022 … gold posted limited gains as the US entered a rate hiking cycle. The macro backdrop is different in 2026, but the sensitivity to rates remains.”
Three forces compounded the gold target reduction pressure. Turkey’s central bank sold 52 tonnes between February 27 and March 27. ETFs flipped from buying 150 tonnes in January–February to selling 90 tonnes in March as fed rate cuts gold price expectations evaporated. Then gold broke its 50-day and 100-day moving averages back-to-back, triggering systematic CTA selling that pushed daily outflows to a peak of 14 tonnes on March 19.
Where gold found a floor — and what drives recovery
Gold stopped falling at its 200-day moving average, which Morgan Stanley reads as a sign that long-term conviction held. ETFs bought back roughly 39 tonnes of what they sold in March. Morgan Stanley’s economists expect the Fed to deliver two 25 basis-point cuts, in September and December. On the question of whether the oil shock derails that timeline, the bank stated:
“The key variable for policymakers is not headline inflation, which has been pushed higher by energy prices, but whether long-term inflation expectations remain anchored. So far, those expectations have stayed relatively stable, even as short-term inflation gauges have risen in response to higher oil prices.”
Also Read: Why BRICS Nations Keep Buying Gold as Prices Hit $4,850
Fed rate cuts in September and December remain the key catalyst for the gold price forecast. If those cuts arrive, ETF buying picks back up and the rising yields gold outlook starts to fade. Morgan Stanley gold forecast target of $5,200 becomes realistic from there. The bank does flag some risks though. A conflict re-escalation could push yields right back up, and oil prices staying high long enough to bleed into core inflation would give the Fed every reason to sit on its hands. A stock market selloff could also force margin calls, pulling gold down with everything else. And even without any of that, the gold target reduction itself creates a ceiling. At these prices, ETFs, central banks, and consumers simply have less firepower to buy.